Dr. Brooks Robinson\Black Economics.org
Photos: YouTube Screenshots
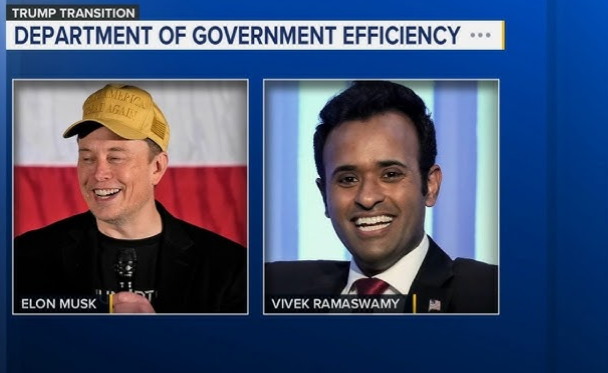
The most dramatic development since the November 5, 2024 election for some economists was an announcement by forthcoming President Donald Trump concerning a prospective new US Government bureau (“Department of Government Efficiency”), the potential closures of selected existing bureaus, and the related roles of billionaire Elon Musk and former US President Candidate and near billionaire Vivek Ramaswamy in helping materialize these Trump Administration goals.

This entire development cast an awkward spotlight on US Federal Government spending. When
we considered these developments, as we did similar developments over two decades ago, the
following questions surfaced:[i] (1) How would the US economy have fared absent strong US
Federal Government growth? and (2) How has US Government spending tracked over the years
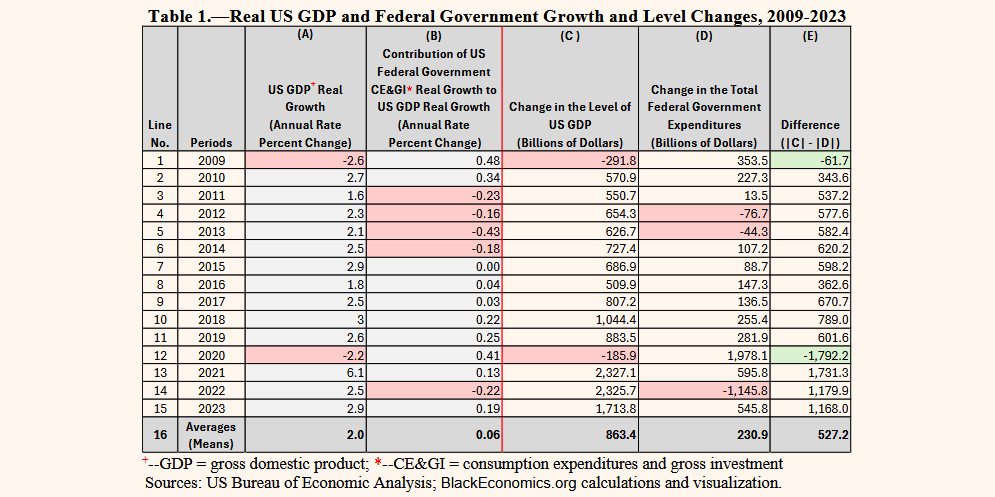
since the “Great Recession”? Table 1 serves up answers to these two questions.

Columns A and B of Table 1 show real gross domestic product (GDP) growth and the Federal
Governments contribution to that growth through consumption expenditures and gross investment
(CE&GI).[ii] GDP growth is negative for only two of the 15 years: 2009, which was the end of the
Great Recession; and 2020, which was the onset of the Covid-19 Pandemic. For both years, the
Federal Government contributed nearly one half of one percent to real growth; meaning that strong
government output dampened declines that occurred in other economic sectors. However, it is also
true that Federal Government real output contributed negatively to GDP during 2011-2014. These
slight declines during Obama years occurred when real GDP growth averaged just above 2.0
percent due to strength in other sectors of the economy.
The three right most columns of Table 1 highlight annual changes in: Nominal dollar GDP (column
C);[iii] (ii) Total Government Expenditures (Current (not Consumption) expenditures (including
Current transfers), Gross investment, Capital transfers, Net purchases of nonproduced assets, less
Consumption of fixed capital (akin to depreciation)) (column D);[iv] and (iii) the absolute value of
the difference between columns C and D (column E). Be certain to differentiate between the
estimates in this right- hand portion of the table, which are not adjusted for inflation, and the
percent change estimates that are based on real, inflation adjusted, values in columns A and B.
Focus for a moment on Column E. Only two negative values appear in the column (2009 and
2020), which is consistent with two years of negative real GDP growth over the period. These two
years are characterized by relatively high levels of Total Government Expenditures (column D)
that partially offset downturns elsewhere in the economy.
Also, it is noteworthy that column D only reflects three downturns in Total Government
Expenditures (2012, 2013, and 2022). For 2012 and 2013, the declines are small and real GDP
growth remained above 2.0 percent. For 2022, the over $1.1 trillion decline in Total Government
Expenditures followed a more than $2.5 trillion increase in expenditures over the two preceding
years, which was a response to the Covid-19 Pandemic.
Should Federal Government Expenditures and their impact on the economy be purposely and
forcefully reduced? Viewed at the aggregate level, a “yes” answer does not emerge forcefully.
Table 1 shows periods of sizeable increases and decreases in Federal Government Expenditures
that seem to balance weakness and growth in other economic sectors, respectively. Economists
generally agree that this is how fiscal policies should operate. On the other hand, this 15-year
period of analysis reveals that annual average changes in Total Government Expenditures ($230.9
billion) exceeds 25 percent of average annual changes in GDP in nominal dollars ($863.4 billion).
As noted, this is due in part to the presence of two major downturns in the nation’s economy.
Consequently, it is not logical to use this metric alone to justify efforts to reduce Federal
Government Expenditures. A more measured strategy might be to use technology and innovations
to research methods for forestalling high levels of economic volatility (evidenced by deep
recessions and steep recoveries so that large increases and decreases in government expenditures
are not required to dampen downturns in, or overheating of, the economy.
Unfortunately, since “discretion” replaced “rules” in managing the US economy, it appears that
economic volatility has increased substantially—not decreased.[v] A wise strategy might be to solve
the economic volatility problem before cranking down government spending forcefully.

Dr. Brooks Robinson is the founder of the Black Economics.org website.
References:
[i] It is interesting that the topic of our 1998 doctoral dissertation was, Bureaucratic Inefficiency: Failure to Capture the Efficiencies of Outsourcings. An article with the same title is available in Public Choice (2001): Vol. 107. No. 3/4; pp. 253-70.
[ii] The relevant statistics are from BEA’s National Income and Product Account (NIPA) Table 1.1.2. Contributions to Percent Change in Real Gross Domestic Product.
[iii] These statistics are from BEA’s NIPA Table 1.1.5. Gross Domestic Product.
[iv] These statistics are from BEA’s NIPA Table 3.2. Federal Government Current Receipts and Expenditures.
[v] This statement is based on the following computational results. First, we established two Federal Reserve Board (FRB) monetary policy regimes using information from a timeline available here: https://fraser.stlouisfed.org/timeline/monetary-policy-history (Ret. 112224). The two regimes are: (1) Greenspan –1988-2005; and (2) Bernanke – 2006-Present. The Greenspan regime covers his tenure as FRB Chairman and is consistent with the use of rules to guide monetary policy. The Bernanke regime begins with his accession to the FRB Chairmanship and extends to the current period, which is characterized by a discretionary-type approach for
conducting monetary policy. Second, using quarterly GDP real growth rates from BEA (NIPA Table 1.1.1. Percent Change from Preceding Period in Real Gross Domestic Product) for the two regimes, we computed sample variances in EXCEL as a measure of volatility. Third, the Greenspan regime yielded a sample variance of 4.5, while the Bernanke regime yielded a sample variance of 34.8. Both regimes include 18 observations, and two National Bureau of Economic Research designed recessions. However, the Bernanke regime experienced much deeper and longer-duration recession than the Greenspan regime.


