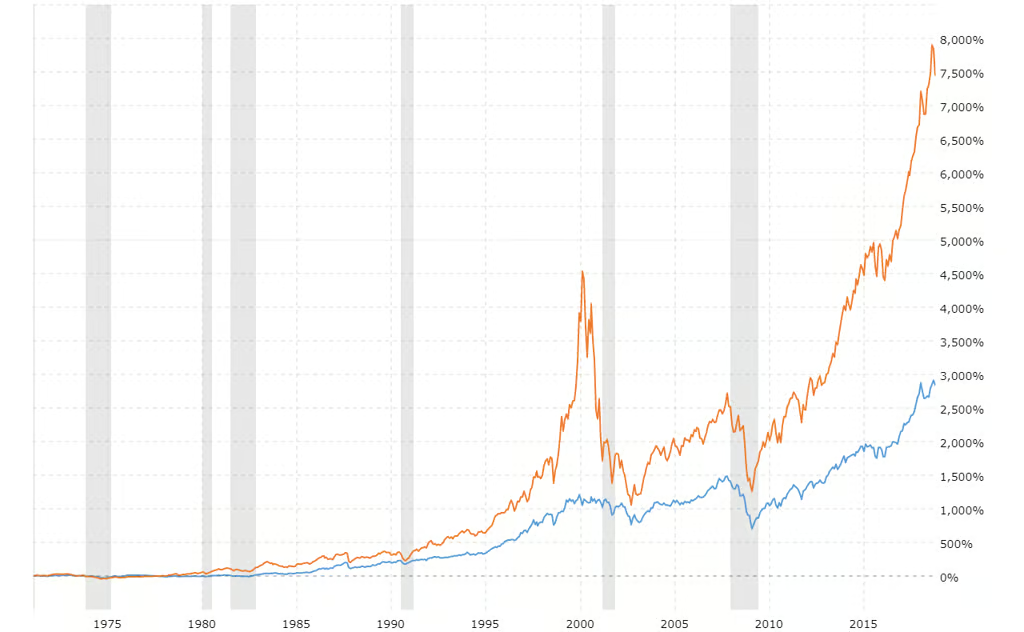
Stock market indices are an essential tool and determining the health of financial markets for investors economists and analysts. Among all the tools there are two most prominent tools that are Dow Jones vs. S&P 500. Both tools are incredibly important in the assessment of market Trends but whether differences in their composition Calculation and purpose. This blog will take a look at these two major industries and compare the two to determine which one really serves as a better indication of market health.
Understanding the Dow Jones Industrial Average (DJIA)
History and Background of the Dow Jones
The Dow Jones was an industrial average developed in 1896 by Charles Dow and Edward Jones. It is considered as one of the oldest stock indices in the whole world. At first, it started with 12 companies but increased overtime to cover at least 30 large cap forms.
Also read: Top 10 Companies in Dow Jones and what do they do?
Composition
The Dow tracks 30 of the largest publicly traded companies in the United States. That is why they are referred to as Blue chip stocks. These are the market leaders that operate in several fields like technology financial services health and consumer products.
Calculation Methodology
The Dow uses a price waited methodology which means that the index value will be influenced more by the higher-priced stocks. The total prices of all 30 stocks are added up and then divided by a unique divisor to account for stock splits and other adjustments.
Market Reputation
Though the Dow covers companies from various sectors it does not cover as broad as with other indices. It can sometimes be less representative of the economy because of this narrow focus.
Limitations of the Dow
Limited scope this list includes only 30 firms representing just a tiny fraction of the market.
Price Weighted Bias: Companies that have relatively higher stock prices tend to influence the index disproportionately without any regard for market size.
Sector Imbalance: The Dow might be over-represented in certain sectors while under-represented in others.
Understanding the S&P 500
History and Origin of the S&P 500
Established in 1957 S&P 500 was emulated to be a benchmark to Mirror the performance of the largest Companies listed on public platforms in the United States. It is run by S&P Global.
Composition
The S&P 500 comprises 500 companies from various sectors. These companies account for nearly 80% of the total stock market capitalization of the US which means it is a relatively wider and more comprehensive index than the Dow.
Calculation Methodology
The S&P 500 uses a market capitalization weighted methodology. This gives more influence to companies with large market caps in their calculations. This approach better reflects the economic size and influence of its constituents.
Broad Market Representation
The S&P 500 is representative of the general market as it covers 500 companies cutting across all sectors. It provides a more accurate picture of the overall market and economic health.
Limitations of the S&P 500
Market Cap Bias: Bigger firms can overshadow smaller firms which will ultimately dominate the index.
It covers everything but does consider the performance of smaller or emerging companies.
Key Differences between Dow Jones and S&P 500
Composition: The Dow covers 30 stocks as the S&P 500 tracks the 500
Calculation Methods: The Dow uses price-weighted calculations while the S&P 500 follows market cap waiting calculations.
Sector Coverage: The S&P 500 offers greater sector coverage than the Dow.
Investor Suitability: The Dow tends to draw those more interested in Blue chip stocks while the S&P 500 tends to be more appealing for a diversified representation of the market.
Which is a Better Indication of Market Health?
Let’s now see which of them is a better indicator of market health by looking out at the factors that decide it.
Depth of market coverage
The S&P 500 offers a better and much broader perspective of the market since it covers an extensive cross-section of industries and companies of different sizes. It therefore provides a better indication of general market direction.
Volatility Tracking
The Dow focuses on only 30 companies which means that their performance can be distorted by a few outliers and is not effective for tracking overall market volatility.
Representativeness of the Economy
The S&P 500 diverse sector representation makes it a better representative of the US economy compared to the Dow’s narrow focus.
Investor Perception
While the door is more familiar due to its historical significance the S&P 500 is widely regarded by analysts as the more reliable indicator of the market health.
How to use both indices together
Complementary Insights
Investors and analysts can use the Dow and S&P 500 together for an integrated perspective.
The Dow is useful in following short-term market sentiment because of its focus on Blue chip companies.
The S&P 500 gives a long-term perspective of the economy and market.
Application:
When markets are going into turmoil the ability to see both indices can give investors inside as to whether volatility is limited to Blue chip stocks or the whole market.
Criticism and Emerging Market Indicators
Limitations of Old Indices
While the Dow Jones vs. S&P 500 are useful they cannot be entirely representative of modern market dynamics such as the Tech heavy stock or small-cap growth companies.
Emerging Indices
New indices like Nasdaq 100 and Russell 2000 are increasingly emerging:
Nasdaq 100 is the index that tracks technology and innovation-intensive companies.
Russell 2000 follows small-cap companies providing insight into emerging market trends.
These indices are supportive of old Benchmarks like the Dow and S&P 500.
Also read: DJIA Analysis: Dow Jones Top Stocks to Watch Today as of December 2024
Conclusion
Both the Dow Jones vs. S&P 500 are excellent indicators of the health of the market but they are suitable for different purposes because of differences in. Generally, the S&P 500 is a Better Indicator of overall market friends because of its broader coverage and sector diversity. The Dow is a very important indicator to follow the Trends of major blue chip companies. Using both indices strategically will give investors a comprehensive view of the health of the market.


